Golf Ball Compression Chart: What the Numbers Actually Mean
Compression charts are everywhere, and they all quote confident numbers. So we went to the manufacturers' own pages to find where those numbers come from. Mostly, they don't.
Jump to a section
Compression measures how much a ball deforms under load, on a scale usually quoted from about 30 to 120. But the major manufacturers do not publish compression numbers for their balls — we checked five, including the three biggest, and found none. The figures in every chart online come from third-party testing or from other people's estimates, and there is no single industry test, which is why the same ball appears with different numbers depending on where you look. Use compression to compare balls within one brand's range, where the maker's own ordering is reliable. Do not use it to compare across brands.
Search for a golf ball compression chart and you will find dozens, all laid out with the same reassuring precision. Pro V1: 90. Chrome Soft: 75. Supersoft: 38. Neat columns, two significant figures, no hedging.
So we did the obvious thing and went to look at where those numbers come from. We opened the manufacturers' own product pages for five well-known balls and searched them for the word "compression."
The auditWhat the makers actually publish
Here is exactly what we found, checked in August 2026:
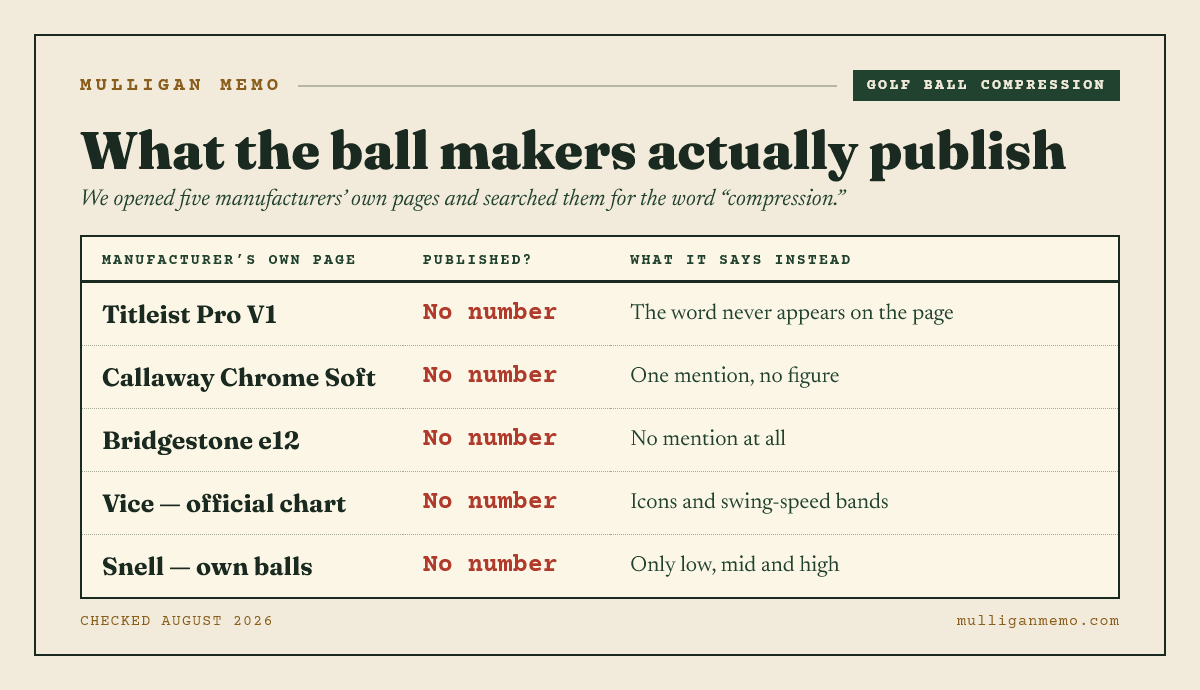
| Manufacturer page | Compression number published? | What it says instead |
|---|---|---|
| Titleist Pro V1 | No — the word "compression" does not appear on the page at all | "A softer gradient core produces a softer feel and slightly less spin than Pro V1x" |
| Callaway Chrome Soft | No — one mention, no figure | "engineered to generate the most speed from a golf ball with our best compression and material properties" |
| Bridgestone e12 Straight | No — zero mentions | Performance and dimple-technology claims only |
| Vice — official comparison chart | No — icons and swing-speed bands, no numbers | "Optimized for high swing speeds" / "medium swing speeds" / "all swing speeds" |
| Snell Golf | Not for its own balls — only categories | Publishes hedged figures for rivals ("Titleist Pro V1: approximately 90") while describing its own MTB range only as low, mid and high |
Checked August 2026 on each manufacturer's own product or comparison page. Sources: Titleist · Callaway · Bridgestone · Vice · Snell. This is five pages, not every ball on the market — but it includes the three largest ball makers in golf.
The Titleist result is the one worth sitting with. The Pro V1 is the best-selling golf ball in the world and sits at the top of nearly every compression chart ever published, usually at 87, 90 or thereabouts. Titleist's own page for it does not contain the word "compression" even once.
The Snell result is the most revealing. Snell's article ranks on the first page of Google for this exact search, and it lists confident-sounding numbers for its competitors — Pro V1 "approximately 90," Callaway Supersoft "around 38" — while describing its own MTB balls only as low, mid and high. A manufacturer will estimate someone else's numbers. It will not put a number on its own.
The reasonThere is no single compression test
Snell also explains why, in a sentence buried in the same article that most readers skim past:
"The gauge variations and tests used to measure compression can vary from one manufacturer to another."Snell Golf, How Golf Ball Compression Ratings Affect Performance
That is the whole problem in one line, from a ball manufacturer. Compression is not a regulated specification like a USGA conformance ruling. It is a measurement, and the number you get depends on the rig you measure it with and the load you apply. Two labs can measure the same ball honestly and print different numbers.
So when a chart tells you a ball is 87 and another chart says 92, neither is necessarily lying. They are quoting different measurements — or, more often, quoting each other.
The hedging language in the charts themselves gives the game away. Watch for "approximately," "around," and "roughly." Real published specifications do not need those words. A ball's diameter and weight are governed by the Rules of Golf and stated exactly. Compression gets an "around."
Where real numbers come fromSomeone does measure these
There is one honest source of comparable compression figures: independent labs that measure every ball on the same rig, in the same conditions, and publish the methodology alongside the result. MyGolfSpy's annual ball test is the best-known of these and is worth reading directly if you want measured numbers rather than repeated ones.
The important distinction is not "manufacturer good, third party bad." It is the opposite of what most charts imply. A single lab measuring 30 balls the same way produces numbers you can genuinely compare to each other. A chart that collects figures from thirty different sources produces numbers that cannot be compared at all, even though it looks tidier.
If a chart does not tell you who measured the ball and how, the tidiness is the only thing it has.
What to use insteadThree things that are actually published
None of this means compression is meaningless. It means the cross-brand chart is the wrong tool. Here is what holds up.
1. Ordering within one brand. Manufacturers are reliable about which of their balls is softer than which. Titleist states plainly that the Pro V1 has "a softer gradient core" than the Pro V1x. Callaway's range is ordered by design and they say so. Vice bands its own balls by swing speed. That relative ordering is a real, published, useful fact — it just doesn't survive being converted into a number and compared to another company's ball.
2. Construction, which is always published. Piece count and cover material are stated by every manufacturer because they are manufacturing facts, not measurements. A two-piece ionomer ball and a four-piece urethane ball behave differently in ways that matter far more to your scoring than a compression figure — particularly around the green, where the cover does the work. Our golf ball buyer's guide covers what each construction actually changes.
3. Price tier, which is an honest proxy. Ball pricing tracks construction closely. If you are choosing between a $25 dozen and a $55 dozen, you are mostly choosing between ionomer and urethane covers — a difference you can feel on a half wedge and that no compression number captures.
The mythMatching compression to swing speed
The most repeated claim in this whole category is that you should match ball compression to your swing speed — under 85 mph gets a low-compression ball, over 105 gets a high one, with tidy bands in between.
The bands vary between charts, which is the first clue. The second is that the manufacturers whose balls those charts list do not publish the mapping. Vice bands its own range by swing speed, so the general idea is not invented — but the specific "your speed is X therefore your compression is Y" table is not something the ball makers put their names to.
The practical version is simpler and does survive scrutiny: softer balls tend to feel softer, and slower swings compress them more easily. If you swing slowly and a firm tour ball feels like hitting a rock, a softer ball will feel better and you will probably putt and chip with more confidence. That is a real benefit. It is just not the precise engineering match the charts imply.
The last wordWhat the chart is for
A compression chart is a decent way to get a rough feel for where a ball sits in the market. It is a bad way to make a $50 decision, because the numbers in it are not measured the same way, mostly are not published by the people who made the ball, and get copied between sites until they harden into fact.
If you want to know whether a ball suits you, the honest sequence is: pick your cover material by budget, pick a construction that matches how much you play around the green, then buy one sleeve — not one dozen — and putt with it. That tells you more in fifteen minutes than every chart on the internet.
FAQCommon questions
What is a good golf ball compression number?
There is no single good number, and the premise is weaker than it looks. Compression is usually quoted on a scale from about 30 to 120, with lower numbers described as softer. But the major manufacturers do not publish compression figures for their own balls — we checked Titleist, Callaway, Bridgestone, Vice and Snell in August 2026 and found none — and there is no single industry test, so figures from different sources are not directly comparable. Compression is useful for comparing balls within one brand's range and unreliable for comparing across brands.
What is the compression of a Titleist Pro V1?
Titleist does not publish one. The word "compression" does not appear on the Pro V1 product page at all; Titleist describes the ball in terms of feel, stating that "a softer gradient core produces a softer feel and slightly less spin than Pro V1x." Figures circulating online for the Pro V1 — commonly around 87 to 90 — come from third-party measurements or from other websites, not from Titleist, and are typically hedged with words like "approximately."
Why do compression charts disagree with each other?
Because there is no standardised industry test. As Snell Golf puts it, "the gauge variations and tests used to measure compression can vary from one manufacturer to another." Two labs measuring the same ball honestly can print different numbers depending on the rig and the load applied. On top of that, most published charts copy figures from other charts rather than measuring anything, so an early error propagates.
Should I match golf ball compression to my swing speed?
Not with the precision the charts suggest. The specific swing-speed-to-compression tables in circulation are not published by the manufacturers whose balls they list, and the bands differ from chart to chart. The defensible version is looser: slower swings compress a ball more easily, so a softer ball will usually feel better and inspire more confidence on short shots. Choose by feel and by cover material rather than by matching two numbers.
Is a low compression golf ball better for beginners?
Often, though for feel rather than distance. Softer balls feel less harsh at slower swing speeds, which most golfers prefer on putts and chips. The bigger decision for a beginner is cost: low-compression balls are usually two-piece ionomer models in the value tier, which is exactly where a new golfer should be while they are still losing several a round. Buy on price and durability first.
Where can I find measured golf ball compression numbers?
From independent labs that test every ball on the same rig and publish their methodology — MyGolfSpy's annual golf ball test is the best known. Those figures are internally comparable because one lab measured them all the same way. A chart that aggregates numbers from many different sources is not comparable, however tidy it looks, and should say who measured each ball.